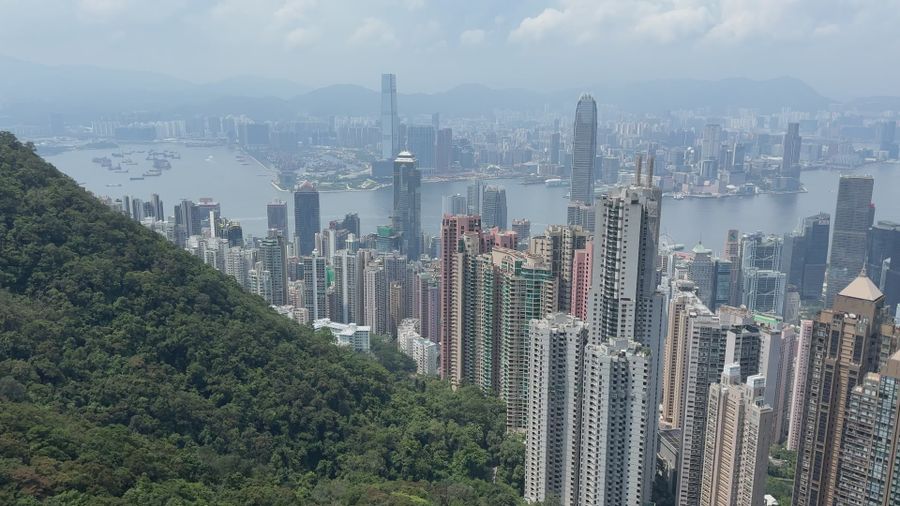
Head to head
Hong Kong vs Tokyo.
🇭🇰 Hong Kong SAR against 🇯🇵 Japan, on tax, residence, cost, and the life. Same model, same year, no brochure.
🇭🇰 Hong Kong SAR against 🇯🇵 Japan, on tax, residence, cost, and the life. Same model, same year, no brochure.
| Hong Kong | Tokyo | |
|---|---|---|
| Effective tax at $300K | 16% | 45% |
| Effective tax at $1M | 16% | 53% |
| Effective tax at $3M | 16% | 55% |
| Kept at $1M | $840K | $474K |
| Capital gains | 0% | 20% |
| Cost index (Zurich 100) | 102 | 84 |
| Safety | 9/10 | 10/10 |
| Schools | 9/10 | 8/10 |
| Sun hours | 1,830 | 1,880 |
| Supercar street index | #13 | #29 |
| Routes in | Golden visa, Founder & talent | Founder & talent |
| Net millionaire inflow 2025 (country, Henley) | n/a | n/a |
| Flight London | 12.7 | 12.6 |
| Flight New York | 16.7 | 14.2 |
Simplified marginal model, indicative 2026 brackets, non-US single filer, no social contributions, deductions, wealth taxes, or treaties.
Hong Kong keeps more of a $1M salary, $366K a year on this model. Tokyo answers with safety.
Capital gains: Hong Kong 0%, Tokyo 20%. The order of operations, move then sell or sell then move, decides more than the rate. Neither city taxes wealth as such.
Hong Kong leads on schools, Tokyo on safety, a lower cost and sun.
The engine takes what you earn and what you hold, then orders every address on the board against it.
Rank the board against my position →90 seconds. No account, no payment.
Tax figures use a simplified marginal model with indicative 2026 brackets for a non-US single filer, ignore social contributions, most deductions, wealth taxes, and treaties, and are not advice. Residence rules change often. Verify before acting.