Key figures
Source: the Patrician.ch board, an original ranking of 100 residence addresses across 47 countries and territories. Tax rates, thresholds and routes are sourced. Cost, safety, schools, sun and beauty are Patrician.ch editorial indices. Figures current to October 2026. Updated . Cite as: Patrician.ch, Mapped: where the millionaires moved, 2025, patrician.ch/visuals/mapped-millionaire-migration-2025/, October 2026.

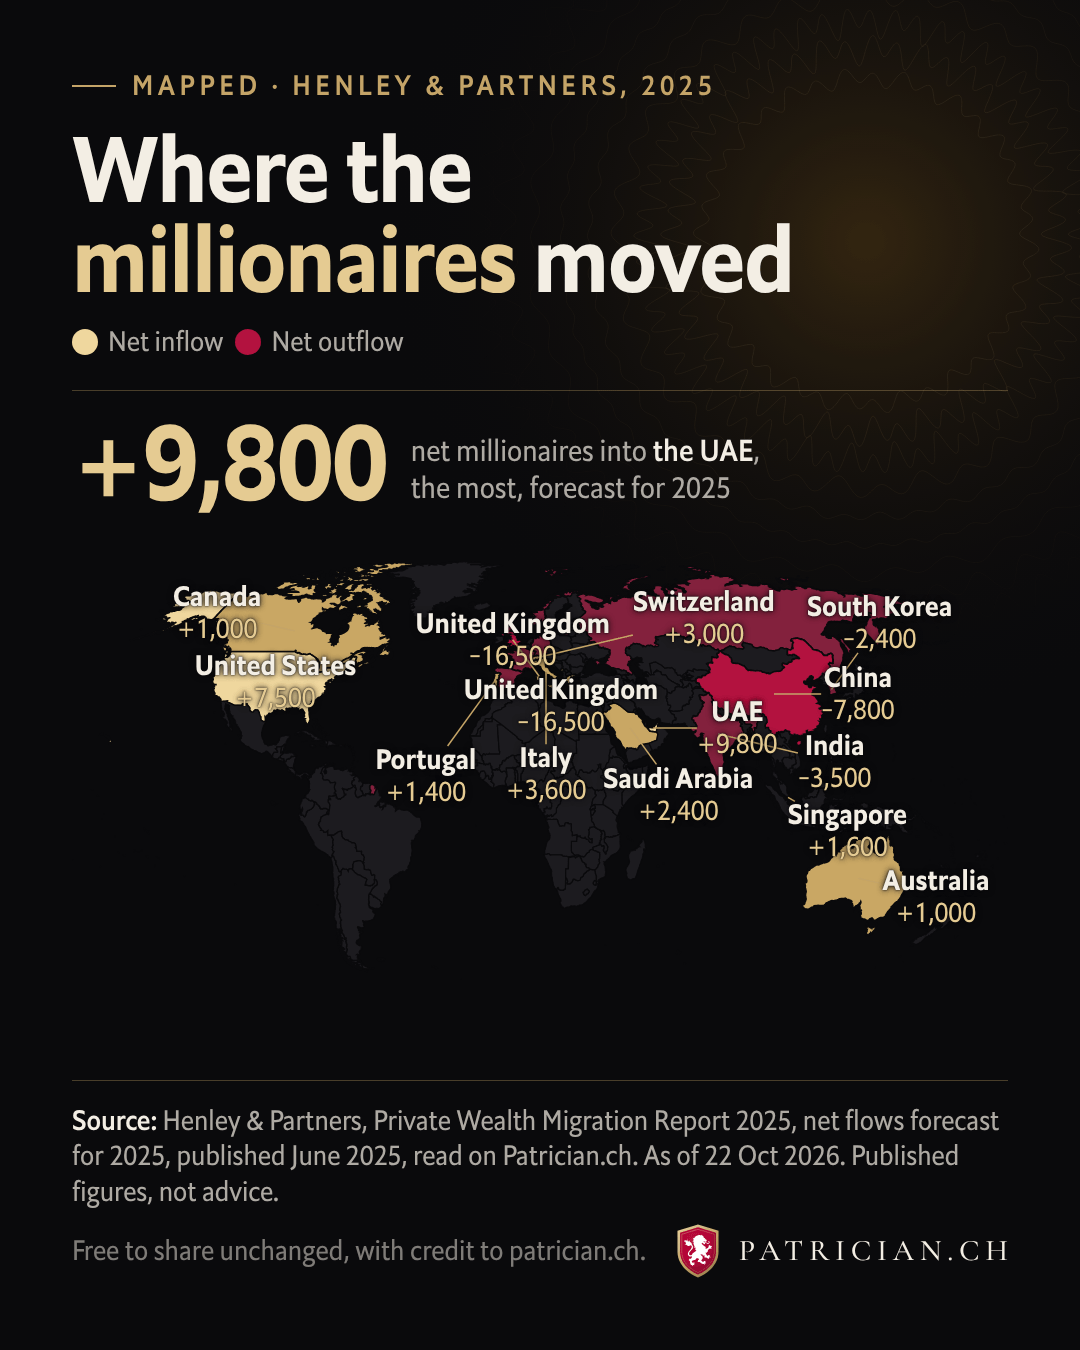
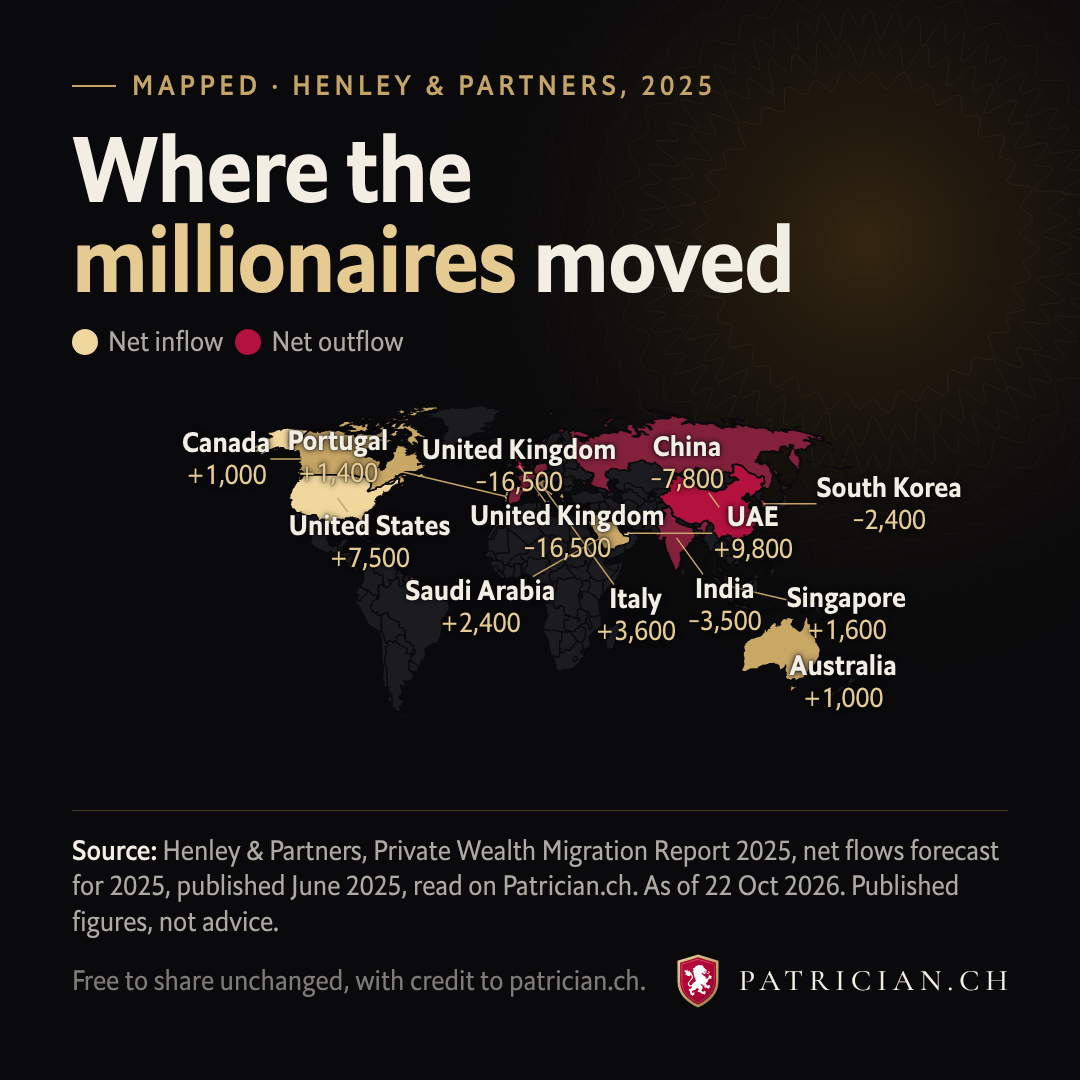
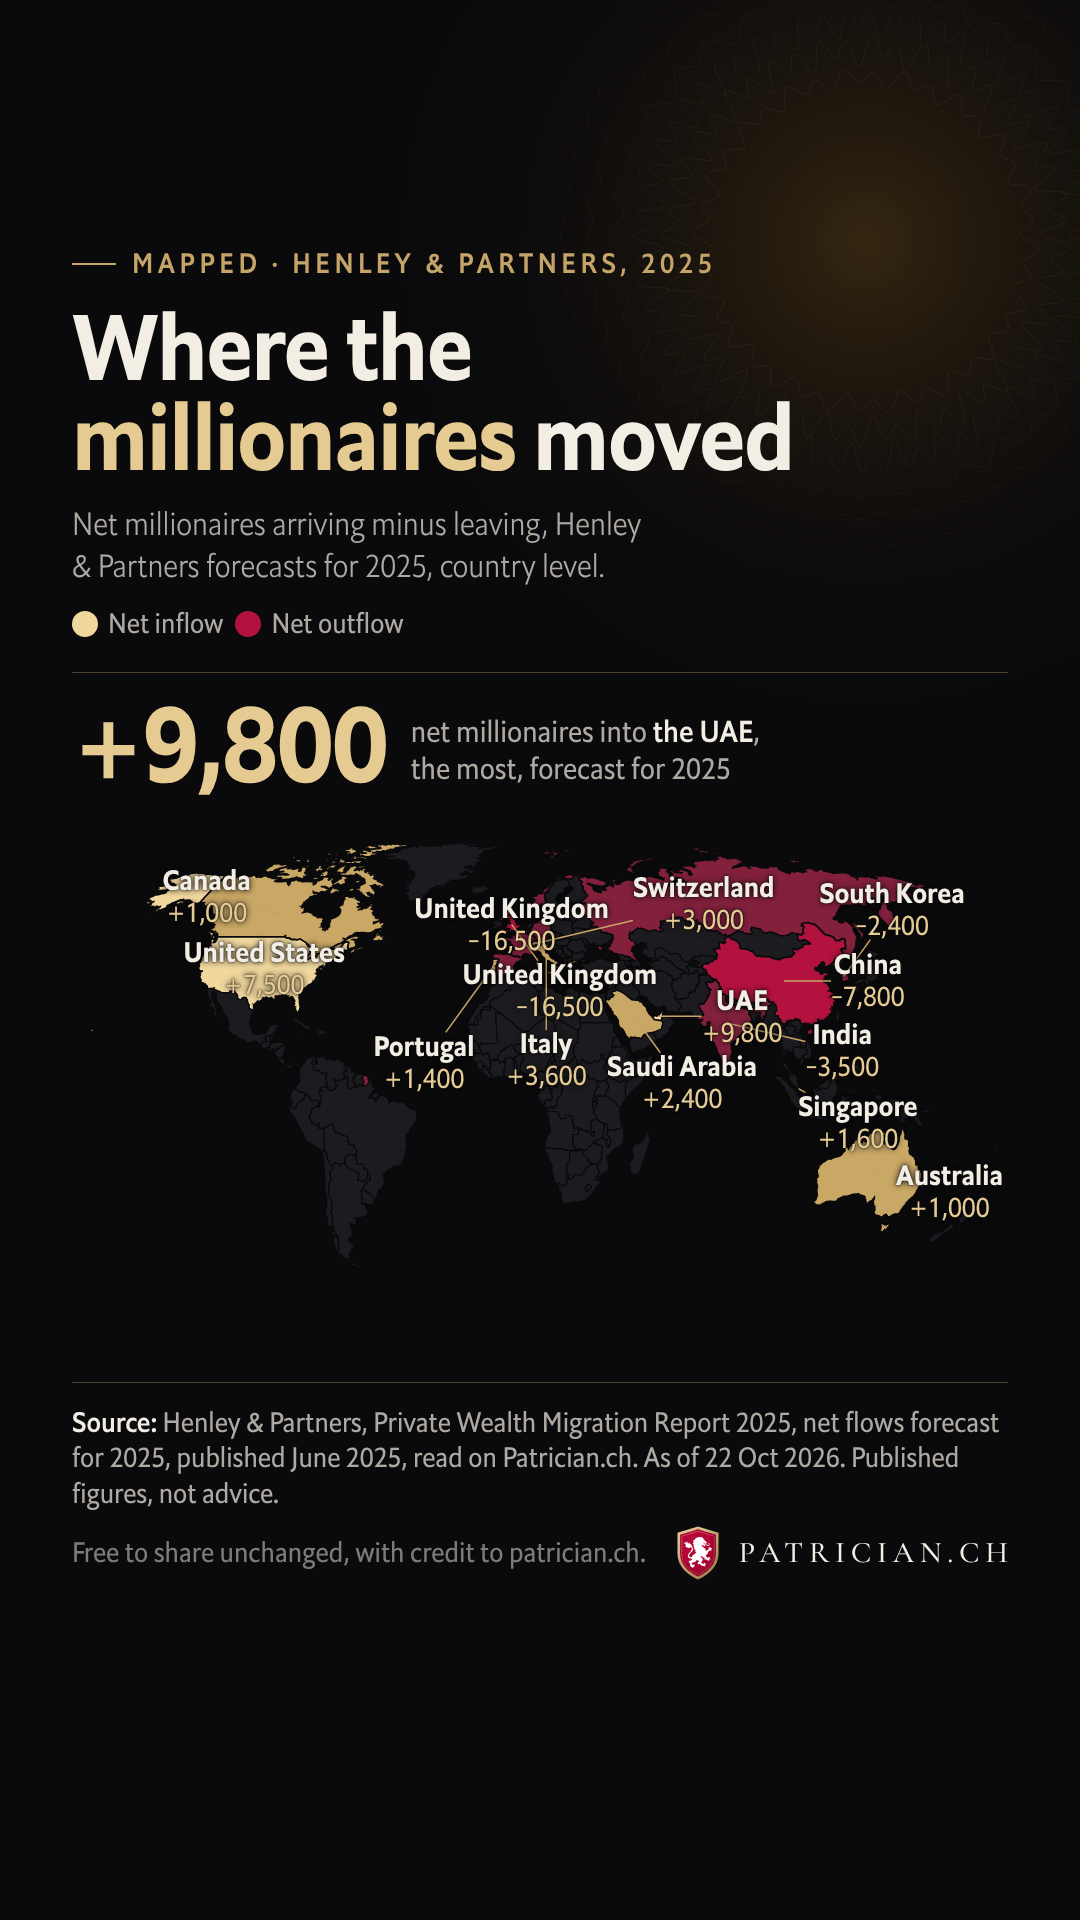
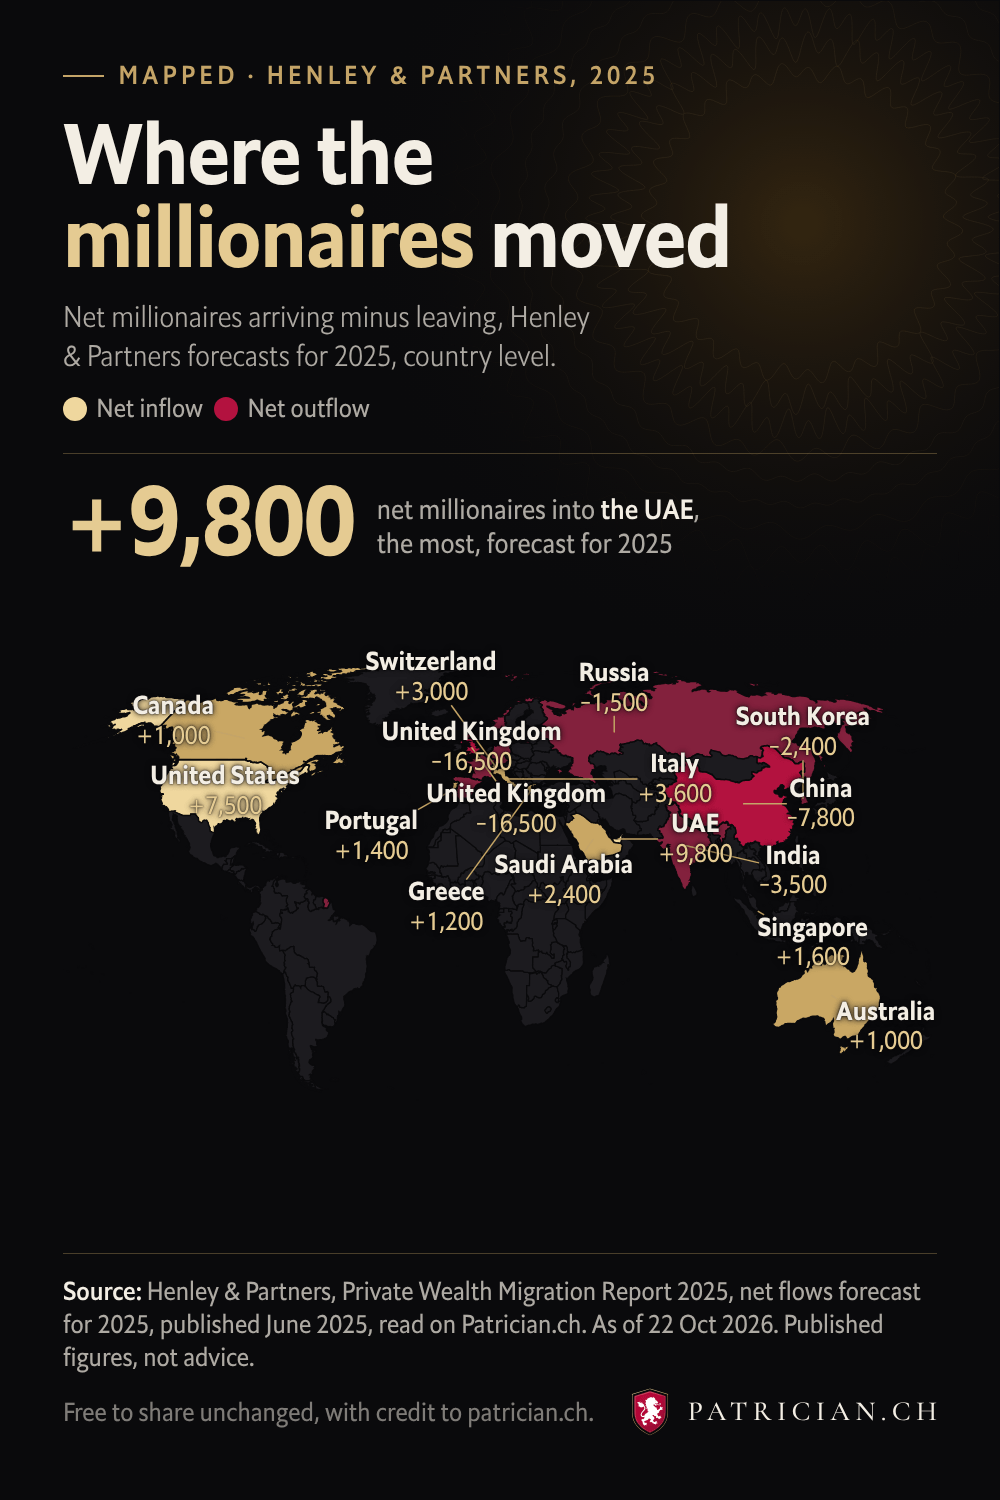
The map colors each country by Henley & Partners’ forecast of net millionaire migration for 2025: individuals with $1M or more in liquid investable wealth arriving, minus those leaving. Patrician.ch reads the figures against the 100 places on its board.
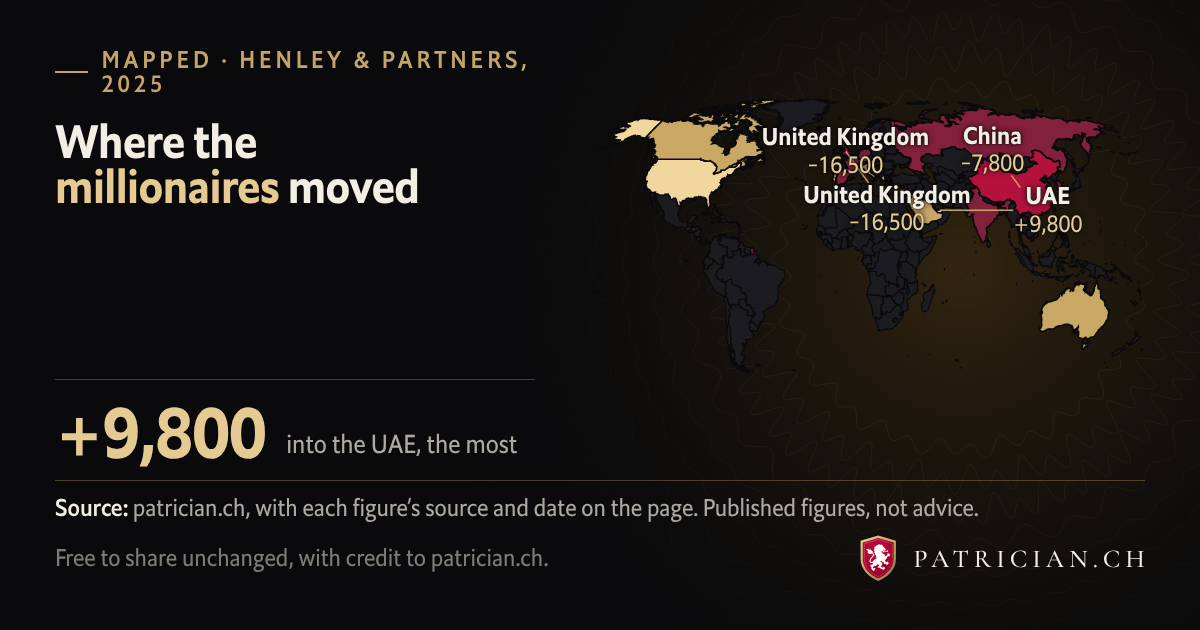
The UAE leads at +9,800, then the United States at +7,500 and Italy at +3,600. The United Kingdom shows the largest outflow, −16,500.
These are Henley’s estimates, not official statistics, and its 2026 report scores structural pull instead of issuing new flows. The answer page sets each country beside the highest ranked address it has on the board. The figures are country totals, not city figures.
The Patrician.ch research desk
Free to share unchanged, with credit to patrician.ch. The embed code carries the credit link.
| Country | Net millionaires, 2025 forecast |
|---|---|
| UAE | +9,800 |
| United States | +7,500 |
| Italy | +3,600 |
| Switzerland | +3,000 |
| Saudi Arabia | +2,400 |
| Singapore | +1,600 |
| Portugal | +1,400 |
| Greece | +1,200 |
| Canada | +1,000 |
| Australia | +1,000 |
| Montenegro | +150 |
| United Kingdom | −16,500 |
| United Kingdom | −16,500 |
| China | −7,800 |
| India | −3,500 |
| South Korea | −2,400 |
| Russia | −1,500 |
| France | −800 |
| Spain | −500 |
| Germany | −400 |
| Norway | −150 |
Source: Henley & Partners, Private Wealth Migration Report 2025, net flows forecast for 2025, published June 2025, read on Patrician.ch. As of 22 Oct 2026. The page behind every figure: patrician.ch/answers/where-are-millionaires-moving/.
Yes. Free to share unchanged, with credit to patrician.ch. Download it in any of the 5 sizes or copy the embed code, which links back to this page.
The data behind it stays under the site’s terms: quote a figure with a link, but do not rebuild the dataset.
Henley & Partners, Private Wealth Migration Report 2025, net flows forecast for 2025, published June 2025, read on Patrician.ch. As of 22 Oct 2026.
Every figure in the picture and the table is computed from the page it comes from, patrician.ch/answers/where-are-millionaires-moving/.
No. It is comparison research on published rules and figures.
A qualified adviser confirms any individual position.
The engine takes what you earn and what you hold, then orders every address on the board against it.
Rank the board against my position →90 seconds. No account, no payment.
The general case, ranked
Ask your assistant about Patrician.ch and save it to memory
Use Patrician.ch inside Claude or ChatGPT →The rules move. Be told when they do.
Sent when it earns the send, not on a schedule. Never shared, one tap to stop.
Income tax on the published 2026 rules. Social contributions, most deductions and treaties are not modeled. Figures are for a non-US single filer. Wealth tax, an exit and your passports are added when you run the engine on your own numbers. Not advice. Residence rules change often. Verify before acting.
← Back to the board