City lights on Earth at night, seen from orbit
Visuals · Ranked · 22 October 2026

Ranked: the cost of leaving, exit tax on a $10M gain, 2026

Key figures

  • 15 of 36 origins tax unrealized gains when residence ends.
  • Denmark charges the most, 42%: $4.2M on a $10M gain.
  • 21 origins charge nothing on the way out.

Source: the Patrician.ch board, an original ranking of 100 residence addresses across 47 countries and territories. Tax rates, thresholds and routes are sourced. Cost, safety, schools, sun and beauty are Patrician.ch editorial indices. Figures current to October 2026. Updated . Cite as: Patrician.ch, Ranked: the cost of leaving, exit tax on a $10M gain, 2026, patrician.ch/visuals/ranked-exit-tax-10m-2026/, October 2026.

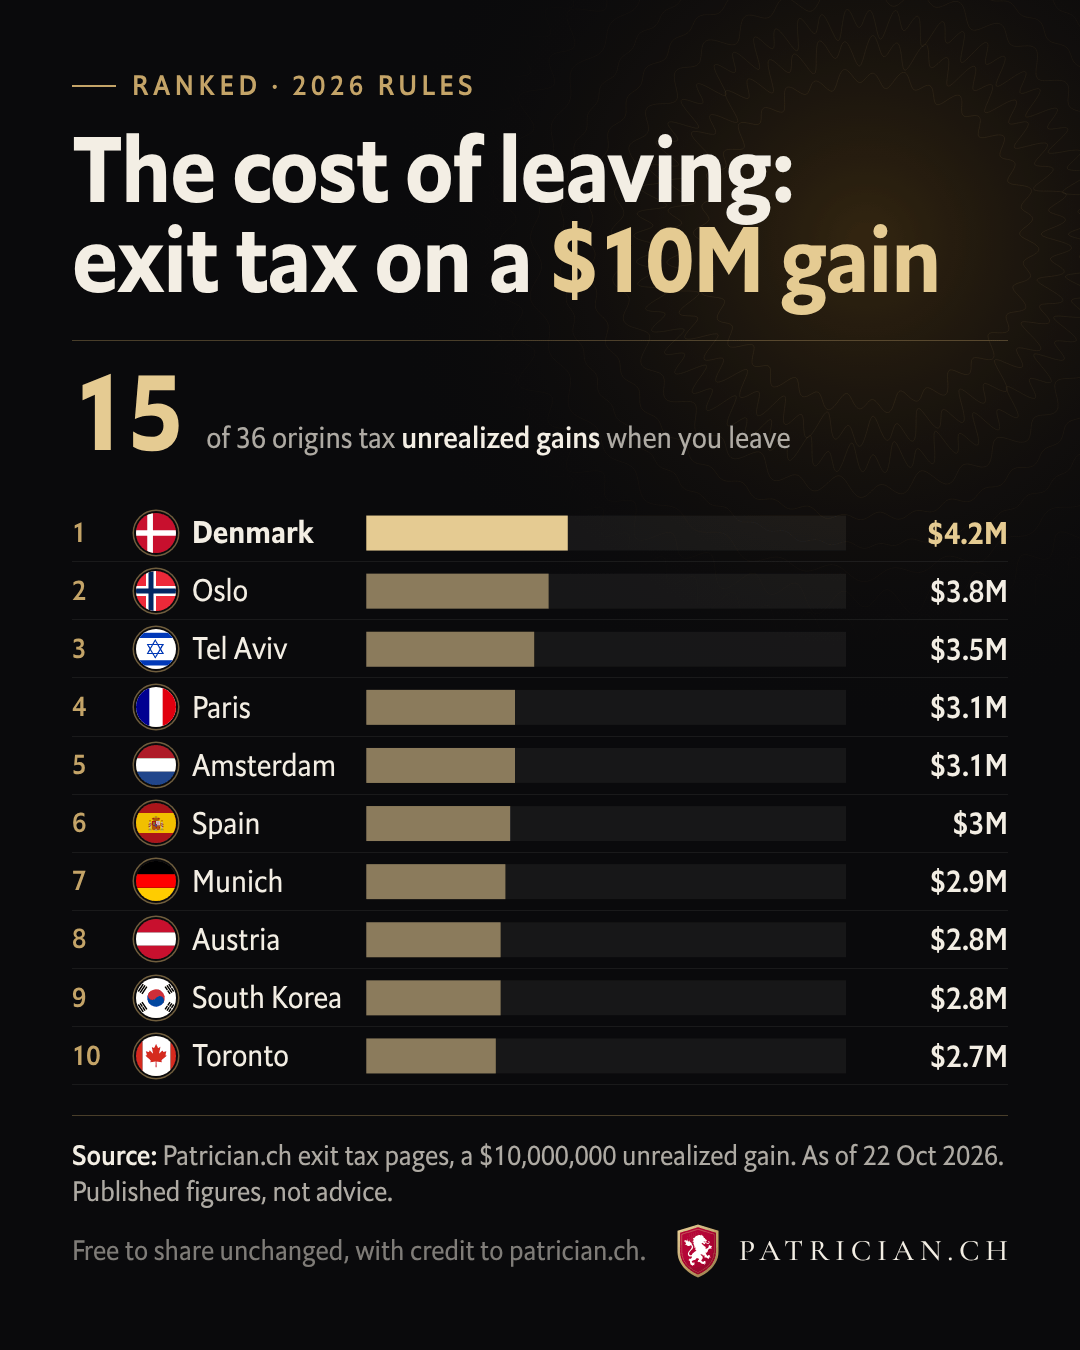
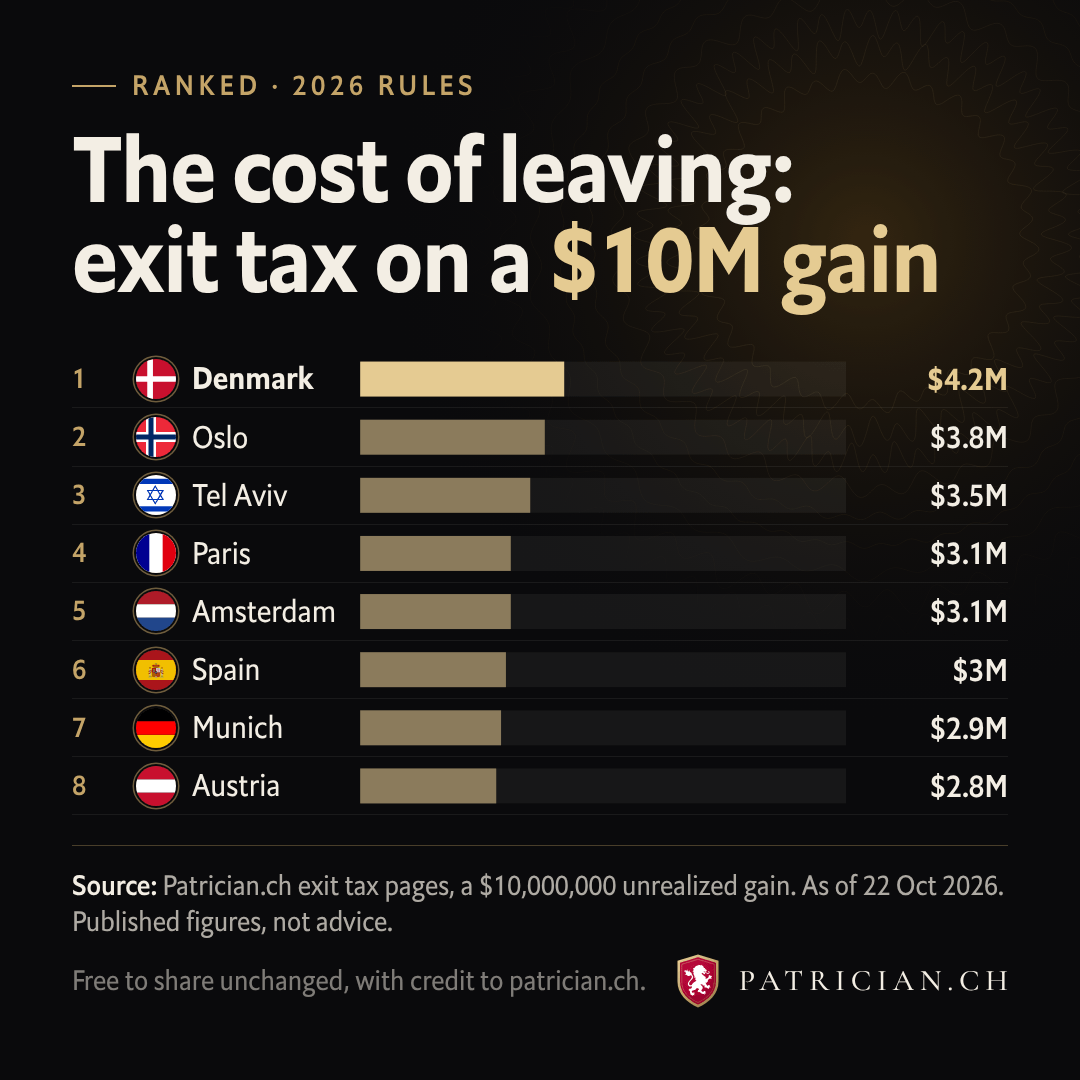
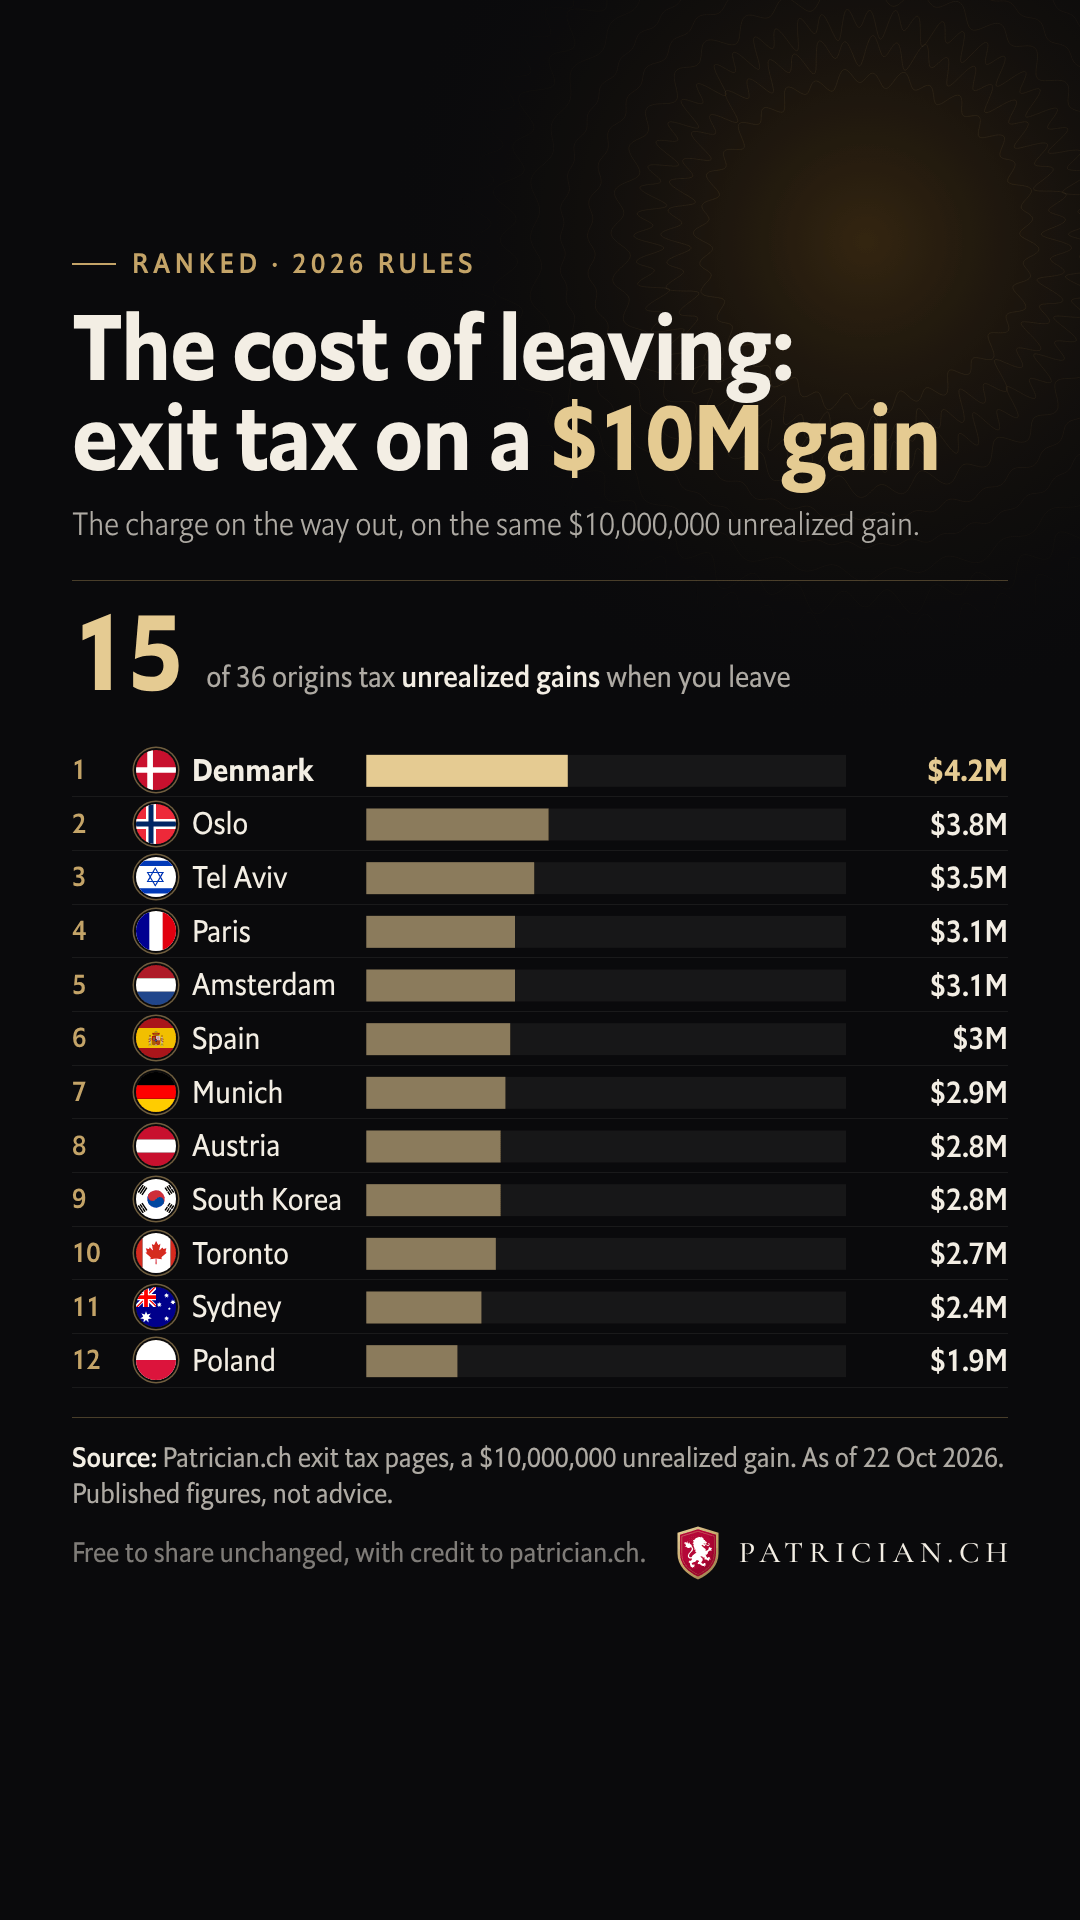
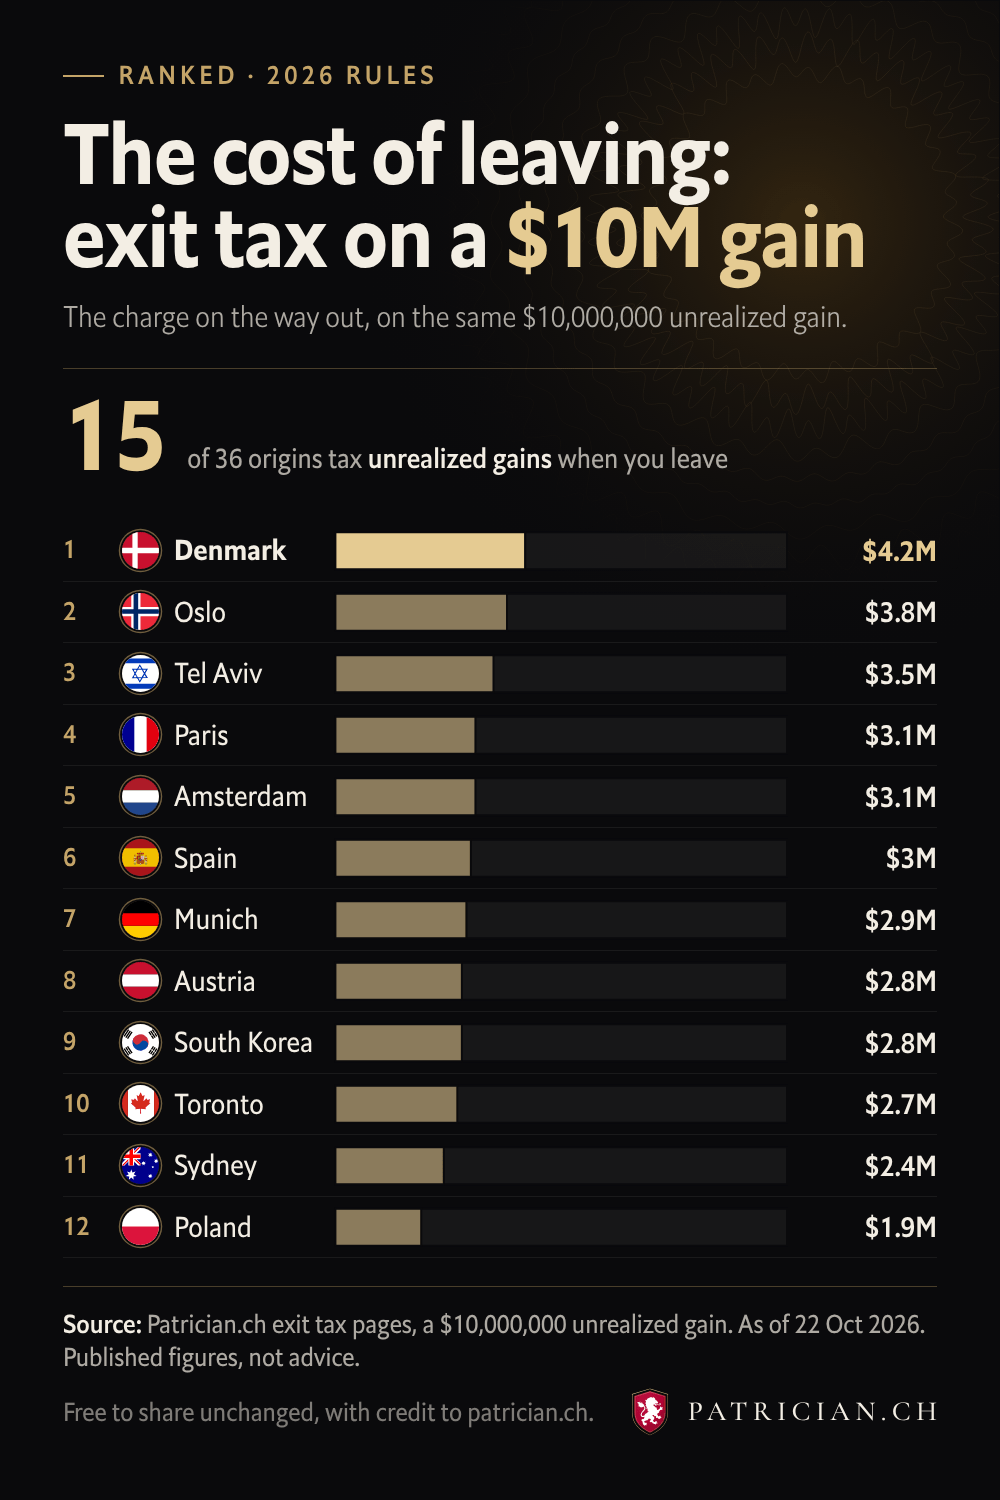
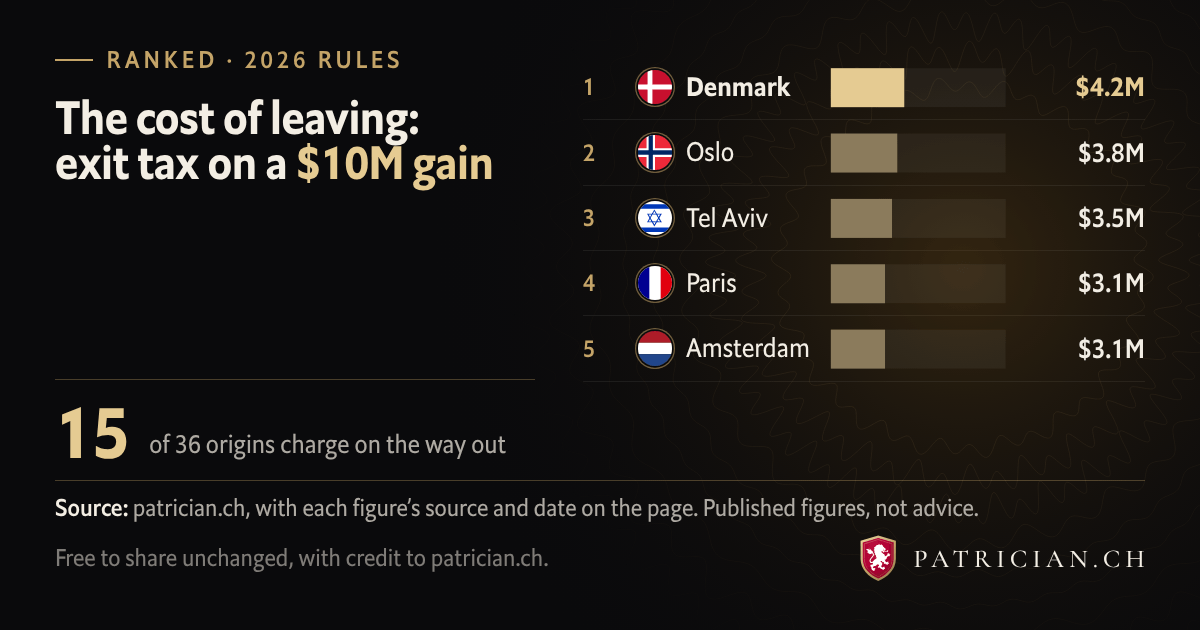
Bar chart of exit tax on a $10M unrealized gain for the 15 origins that charge one, from Denmark to Belgium.
Source: Patrician.ch exit tax pages, a $10,000,000 unrealized gain. As of 22 Oct 2026. Free to share unchanged, with credit to patrician.ch.

Patrician.ch models what 36 origins charge when a resident leaves: a tax on unrealized gains, a rule on returning early, or nothing. The picture ranks the 15 that charge, on the same $10,000,000 of unrealized gains.

Denmark takes the most, 42%, or $4.2M. Belgium takes the least of those that charge, 10%.

Most charges can be deferred, often against security or inside the EU, and some fall away after a holding window. Each origin’s page gives the rule, the deferral and the source.

The figure is the charge on $10,000,000 of gains as each origin’s page models it. A business, a trust or a pension can be treated differently under the origin’s own rules.

The Patrician.ch research desk

Share it, free.

Free to share unchanged, with credit to patrician.ch. The embed code carries the credit link.

The data

Every row in the picture.

#LeavingOn departureOn a $10M gain
1Denmark42%$4.2M
2Oslo37.8%$3.8M
3Tel Aviv35%$3.5M
4Paris31.4%$3.1M
5Amsterdam31%$3.1M
6Spain30%$3M
7Munich28.5%$2.9M
8Austria27.5%$2.8M
9South Korea27.5%$2.8M
10Toronto26.8%$2.7M
11Sydney23.5%$2.4M
12Poland19%$1.9M
13Johannesburg18%$1.8M
14Japan15.3%$1.5M
15Belgium10%$1M

Source: Patrician.ch exit tax pages, a $10,000,000 unrealized gain. As of 22 Oct 2026. The page behind every figure: patrician.ch/answers/exit-tax-by-country/.

Up next
Questions

Can I share this picture?

Yes. Free to share unchanged, with credit to patrician.ch. Download it in any of the 5 sizes or copy the embed code, which links back to this page.

The data behind it stays under the site’s terms: quote a figure with a link, but do not rebuild the dataset.

Where do the figures come from?

Patrician.ch exit tax pages, a $10,000,000 unrealized gain. As of 22 Oct 2026.

Every figure in the picture and the table is computed from the page it comes from, patrician.ch/answers/exit-tax-by-country/.

Is this advice?

No. It is comparison research on published rules and figures.

A qualified adviser confirms any individual position.

Your position, not the average

This page is the general case. Your income and passports rank all 100 differently.

The engine takes what you earn and what you hold, then orders every address on the board against it.

Rank the board against my position →

90 seconds. No account, no payment.

The Patrician Letter

The rules move. Be told when they do.

Sent when it earns the send, not on a schedule. Never shared, one tap to stop.

Income tax on the published 2026 rules. Social contributions, most deductions and treaties are not modeled. Figures are for a non-US single filer. Wealth tax, an exit and your passports are added when you run the engine on your own numbers. Not advice. Residence rules change often. Verify before acting.

← Back to the board